Where are the seedlings that should be on this bench?
- David Anderson

- Apr 29
- 10 min read
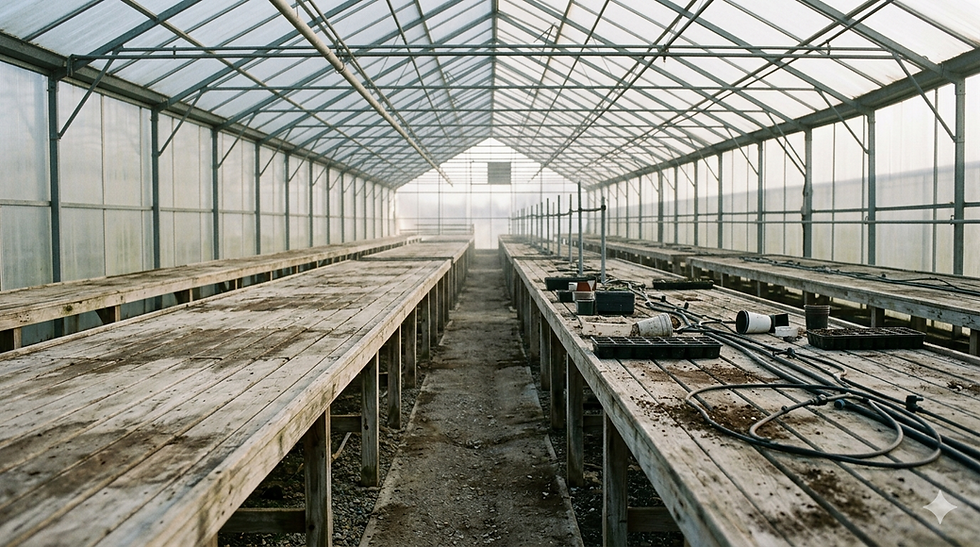
I was doing a routine stocktake of the nursery when I noticed the gap. Empty benches where thirty thousand seedlings should have been growing.
I counted again.
Same result.
I walked the rest of the nursery looking for them. Maybe they were still in the hothouse. Maybe someone had shifted them to another section and forgotten to tell me. There had to be an explanation.
There was. We had hit 20% germination on a batch of thirty-five thousand seeds. 75% below plan. I was staring at an eight-hundred-thousand-dollar hole in our production for the year and I had not known it was coming until I was standing in front of an empty bench.
The stabbing feeling in my gut was not about the money, not at first. It was about the farmers. We had growers relying on us to deliver those trees. People who had planned their seasons, their cash flow, their livelihoods around stock that was not going to exist. They had made promises to their own customers based on what I had told them was coming. I had to call them and explain that it was not.
Then came the anger.
Why does this always happen? Why is it so hard to keep track of everything in this business, all at once? How had nobody flagged this weeks ago, at a point before I walked past an empty bench on a Tuesday morning? Why are avocados so hard to grow?
Then the bargaining.
Could I source seeds from somewhere else? Could I recover the shortfall through better results in other parts of the nursery? I made some calls. I spoke to every supplier I knew. The math did not work and neither did the goodwill. There was no version of this that did not end with growers being told their order was not coming.
And then the quiet that comes after the bargaining fails.
I sat with the numbers for a long time. Another year of missing production targets. Another year of difficult conversations I had not seen coming and could not have prepared for, because I had not known they were coming until it was time to face them.
The part that stayed with me longest was not the loss itself.
It was the feeling that I should have known. Not that someone should have told me. That I should have known. The data existed that could have told me germination was tracking badly weeks before I found out. I just had no system to surface it. No way to see where things were going well and where things were going wrong, in plain language, in time to do anything about it.
I went on to spend two years as a data engineer at Glencore Mount Isa, one of Australia's largest copper mines. Different industry, different scale, completely different problems. But I kept meeting the same feeling. Sitting in meetings with numbers that did not add up, shortfalls that were unable to be seen coming, reacting to problems that had been bubbling below the surface without the right insights to surface them in time.
The empty bench has a different name in every operation. The feeling of standing in front of it is identical.
I was not blindsided because I was bad at my job. I was blindsided because the information I needed did not have a clear path to reach me. That is not a nursery problem. It turns out it is every operations manager's problem.
The data was there. The picture was not.
After the germination batch I started asking myself a question I could not easily answer.
How much stock do we actually have coming through?
Not in total. At each stage. Germination, propagation, grafting, growing on, ready for dispatch. A nursery is not a warehouse. Stock does not sit still. It moves through stages over months and years and the question that matters is not what you have today, but what you will have when the truck comes to pick up an order.
It should have been a simple question. It was not.
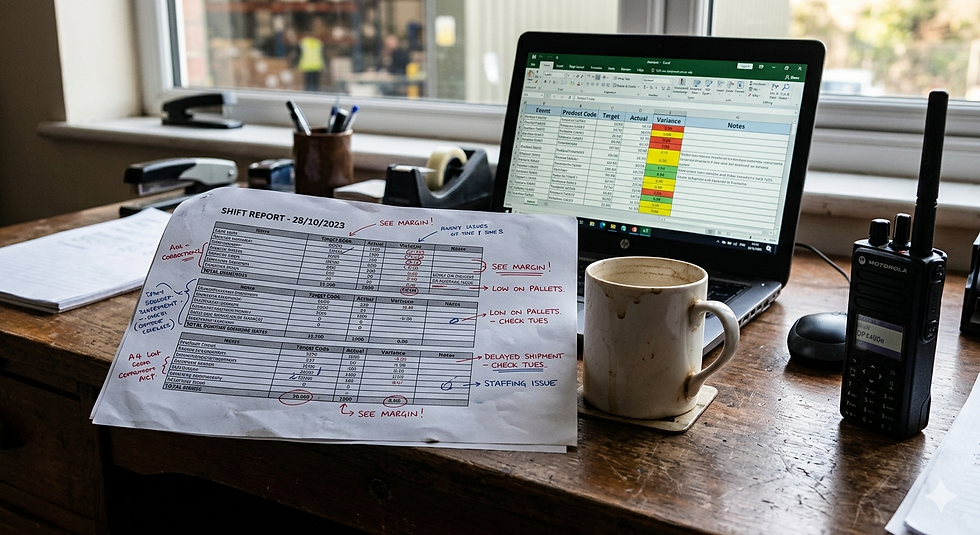
Getting the answer meant opening spreadsheets that different teams maintained in different ways. It meant calling team leads and asking them to count things and call me back. It meant pulling numbers from three different places and trying to reconcile them into something I could trust. On a good day that process took a couple of hours. On a bad day it took longer and the answer I got at the end of it was already out of date.
The frustrating part was that the data existed. Every stage of production was being recorded somewhere by someone. The people were good at their jobs and the numbers they kept were accurate. The problem was not the people, and it was not the data. The problem was that nobody had ever structured it to answer the question I was actually asking.
A germination rate recorded in one sheet. A propagation count in another. Dispatch targets in a third. Each one accurate on its own. None of them connected in a way that could tell me at a glance whether the pipeline was healthy or whether I was looking at another empty bench three months from now.
This is the thing that does not get said enough about operational blindness. It is almost never caused by bad people or missing data. It is caused by data that was never designed to produce a clear picture. Information that was captured for one purpose and never connected to the questions that actually drive decisions.
The germination batch that cost us eight hundred thousand dollars was being recorded. The decline was in the numbers. I just had no way to see it until I walked past an empty bench.
Same number. Completely different problem.
Every section of the nursery had its own language.
Germination counted seeds. Propagation counted seedlings. Grafting counted unions. Finishing counted trees. Each team lead knew their numbers cold and reported them accurately. The problem was that none of those numbers meant the same thing when they reached me.
A thousand losses in germination and a thousand losses in finishing sound identical. They are not. A seed lost in germination had a conversion rate of roughly one in two before it became a saleable tree. A tree lost in finishing was almost out the door. The dollar impact of losing a thousand seeds at germination was around seven thousand five hundred dollars and about half that in trees. The dollar impact of losing a thousand in finishing was twenty thousand dollars and nearly every one of those trees gone from your dispatch target.
Same number. Completely different problem.
Every time a team lead came to me with a loss, I had to run the conversion in my head before I could understand what I was actually dealing with. How far through production was this stock? What was the yield rate from this stage to dispatch? What did this loss actually mean for the trees going out the door at the end of the season?
It was not that my team leads were reporting the wrong things. They were reporting exactly the right things in exactly the right terms for their part of the operation. The problem was that their terms and my terms were different. They were thinking in units. I needed to think in business impact. And there was no system that did that translation automatically. It happened in my head, every time, on the fly, with whatever information I happened to have in front of me.
The risk was obvious in hindsight. If I was running those conversions manually from memory, I was one bad assumption away from getting the priority wrong. Treating a finishing loss like a germination loss. Mobilising resources to the wrong problem. Missing the thing that actually mattered because the number that landed on my desk looked the same as a number that did not.
Every mine site I have encountered since has the same problem in a different form. Time reported in minutes that nobody has converted to tonnes. Utilisation percentages that do not tell you what they cost. Numbers that are accurate in isolation and meaningless for making a decision.
What I built to fix it: a production reporting framework.
Here is what I actually built. I will keep it practical.
After the germination batch I did what most operations managers do after a bad year. I tried to build something better.
Not new software. Not an expensive system. I did not have the budget for that, and I would not have trusted it anyway. What I built was a production reporting framework. A way of connecting data that already existed across the nursery and translating it into one picture that I could look at every day and know, with confidence, where I stood.
The framework had two parts, and they came directly from the two problems described above.
The first problem was visibility. The fix was structure, not more data. I mapped every stage of production against a target. Germination rates by week. Propagation counts against plan. Grafting success against forecast. Finishing stock against dispatch commitments. Not a complicated model. A simple framework that forced the question at every stage: are we on track, and if not, where did we fall short?
The key was that every stage had to account for itself. There was nowhere for a problem to hide. If germination was tracking at 20% when it should have been tracking at 80%, that showed up immediately as a variance against target rather than as an empty bench three months later. The framework did not create new information. It just made the information that already existed visible in time to do something about it.
The second problem was translation. The fix was a common unit. Everything in the framework converted back to dispatched trees. Not because the team leads needed to think in those terms. But because I did. When a team lead came to me with a loss in finishing, I needed to know immediately whether it was a twenty-thousand-dollar problem or a seven-thousand-five-hundred-dollar problem, and I needed to know it without running the conversion in my head on a bad morning.
When I moved into mining, I found the same two problems wearing different clothes.
Visibility: shift data captured in time categories inside a Time Utilisation Model, the shift-level record of where equipment time went. Accurate in isolation. Disconnected from the question that actually mattered at every morning meeting. Are we going to hit target this month?
Translation: time reported in minutes and percentages that experienced operators could read intuitively but that did not tell a manager directly what it cost. Thirty minutes of unplanned downtime means something different depending on the operating rate of the equipment. The conversion happened in people's heads, drawing on experience and intuition, and it was one bad assumption away from getting the priority wrong.
The framework I developed for mining works on the same principle as the one I built at the nursery. It connects data that already exists at shift level, time utilisation categories, call-in logs, planned tonnes, actual tonnes, and translates everything into one unit. In mining that unit is tonnes, because tonnes is the language the business runs on.
The structure has three tiers because each level of the organisation is asking a different question and needs a different view of the same data.
The general manager needs to know one thing: are we on track to hit the month target? The framework gives them a cumulative compliance graph, a run rate, and a projected end of month figure. One view. One question answered. Thirty seconds.
The manager needs to know why. If the operation is behind target, which time category is responsible? How many tonnes did each variance cost? Who owns the conversation? The framework produces a variance waterfall that walks from planned to actual through each time category, expressed in tonnes, with an accountable team mapped to every bar. The manager walks into the morning meeting already knowing not just what happened but who they need to talk to.
The superintendent needs a shift-by-shift record. What happened, when, against what plan. Every shift accounted for, no gaps, no ambiguity. The basis for the handover conversation.
The same data. Three views. Each one answering the question the person reading it actually needs to answer.
This is not a new system. It does not require new data capture or software changes. Every mine site I have worked with already produces everything the framework needs. The gap was never the data. It was always the structure that connected it and the translation that made it useful.
What changes when production reporting works
I spent 75% of my time as an operations manager being reactive. Blindsided by problems I had not seen coming. Putting together reports to understand those problems after the fact. Trying to explain in a morning meeting why the numbers looked the way they did and what it was going to cost.
Only 25% of my time was available to actually manage. To be proactive. To make the business better rather than explain why it was not.
That ratio is not unique to me. I have met enough operations managers across enough industries to know that it is close to the norm. The work that matters most, forward visibility, informed decisions, confident answers to hard questions, gets crowded out by the work of figuring out what is actually going on.
The framework I have described in this article does not change the nature of operations management. Mines are complex. Things go wrong. Unexpected problems will always exist. But the 25% that was reactive because I simply did not have the information I needed, that part is solvable. That part is a data structure problem, not an operations problem, and data structure problems have answers.
When the right information reaches the right person in the right language at the right time, the morning meeting changes. The GM asks if you are going to hit target and you answer in thirty seconds with a number you trust. The manager walks in knowing which conversation to have and with whom. The superintendent has a shift-by-shift record that reflects what actually happened on the ground.
Not because the operation ran perfectly. Because you can see it clearly enough to know what happened, why it happened, and what to do about it.
If any part of this article described your operation, get in touch for a free 20-minute call.
I have recently been working with an underground copper operation on exactly this problem. The conversation starts with your specific situation, not a generic pitch. If the framework is the right fit, we can talk about what building it would involve. If it is not, I will tell you that too.
You can book directly at www.data-wranglers.com.au or reach me at david@data-wranglers.com.au.
If you want to read the full methodology first, the brief is at www.data-wranglers.com.au/are-we-going-to-hit-target. It covers the three-tier structure, the time utilisation to tonnes conversion, and the variance waterfall in detail.
The empty bench taught me that the cost of not seeing clearly is real and it lands hard. It does not have to.
About the author
David Anderson is the founder of Data Wranglers. He spent six years as Operations Manager at Australia's largest commercial avocado nursery and two years as a Data Engineer at Glencore Mount Isa. He founded Data Wranglers in 2025 on the basis that operational businesses are better served by someone who has run an operation than by someone who has only consulted to one.


Comments