Converting your TUM data into primary draw tonnes
- David Anderson

- Mar 24
- 4 min read
A worked example: quantifying production variance in underground mining using data you already have
Time Utilisation Models are the backbone of underground mine reporting. They provide a structured, shift-by-shift picture of where time went, how much was productive, how much was lost to downtime, standby, and external delays, and whether each category tracked against its benchmark.
That is valuable. But there is a step most operations are not taking.
TUM data is reported in minutes. The business runs on tonnes. Bridging that gap is where a significant amount of management intuition currently lives, and where a significant amount of operational visibility is being lost.
What TUM data tells you
A standard TUM report gives you time category splits and benchmark comparisons. It tells you if planned services ran over, or that blast re-entry ate into the shift, or that utilisation was healthy. Experienced operators and supervisors know how to read it and what it means.
Where it stops is the translation into business impact. Time variances reported in minutes don't immediately tell a manager what they cost. That conversion happens informally, drawing on the experience and intuition of people in the room rather than a calculated number.
The result is that the morning meeting produces action items based on directional indicators rather than quantified impacts. People know something went wrong. They don't always know how much it mattered.
The additional data you already have
To take the next step, you need two additional data sources alongside your call-in log and TUM targets. Both are standard outputs of the shift planning and reporting process:
Planned tonnes by shift
Actual tonnes by shift
No new data capture. No changes to existing systems. The methodology sits entirely on data that almost every operation already produces.
What the integration unlocks
By joining these four tables you can build a variance waterfall that walks from planned primary draw tonnes to actual primary draw tonnes through every time category. Each step is expressed in tonnes and mapped to a clear operational owner.
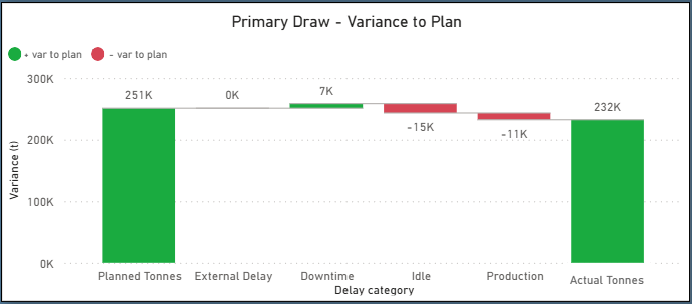
Each bar represents a specific cause:
External delay covers force majeure events entirely outside mine control. Weather, regional power outages, government mandated stoppages. No budget is set and any occurrence is a direct loss against plan.
Downtime covers actual downtime above or below the maintenance budget. Owned by Maintenance.
Idle time covers time lost to blast re-entry, ground conditions, truck availability, congestion, and scheduled standby above benchmark. Owned by operational teams depending on the specific event code.
Production time measures whether the fleet loaded faster or slower than the planned rate, given the face loading time that was available. Owned by the operator and their Supervisor.
The manager looks at this chart and immediately knows what happened, who to call, and what number to put on the impact. That is a more informed conversation to what happens when someone puts a TUM percentage on the table.
Why this closes
The reason this framework works mathematically is that every minute of a shift must be accounted for across the time categories, and the total always sums to the fixed shift length. That constraint means the waterfall is self-auditing.
Adjusting call-in behaviour in one category does not make a variance disappear. It surfaces somewhere else instead. An operator who does not call in end of shift on time does not hide the problem. They compress apparent loading time, and the loss shows up immediately as a productivity rate variance. Every tonne of variance has to land somewhere, and every category has an owner.
This gives the framework a credibility that goes beyond a standard dashboard. It audits back to a fixed number of tonnes that either came out of the ground or did not. A general manager can put this in front of a board with confidence that the numbers add up.
Who owns what
One of the more useful properties of this framework is that ownership is built into the structure rather than assigned after the fact. Each time category maps directly to an accountable team:
External delay sits outside anyone's control but should be visible and quantified
Downtime is a Maintenance conversation
Idle time depends on the specific event code. Blast re-entry is Drill and Blast. Truck availability is Dispatch. Ground conditions is Geotechnical. Scheduled standby is the Supervisor.
Production time is an operator and Supervisor conversation. Given the time they had, how well did they use it.
The manager walks into the morning meeting knowing not just what happened but who the conversation is with before they sit down.
In summary
If your operation already runs a TUM system and produces shift-level location tonnes, you have everything you need to build this. The methodology converts data that already exists into a layer of insight that most operations are currently leaving on the table.
The result is a single view that tells a manager where the variance was largest, who owns it, and exactly what it cost in tonnes.
If you are dealing with operational visibility challenges, lets chat.


Comments